
Driving alignment in Healthcare
Centers of Excellence
Incorporating Centers of Excellence (COEs) into a self-funded plan sponsor’s health benefits ecosystem has become a popular mechanism for ensuring high quality care for members while helping a company control for costs. The SurgeryPlus benefit, offered by Employer Direct Healthcare, was created to utilize a COE approach, focused on credentialing surgeons in addition to facilities, to dramatically lower costs, improve outcomes, and increase transparency across plannable surgical procedures.
“With SurgeryPlus positioned as the clear industry leader in delivery of COEs and bundled payment models, we look to be a force of positive change within the healthcare space, focused on quality of care, member experience and fair pricing for our clients and their members.” John Zutter, CEO Employer Direct Healthcar
Employer Direct Healthcare highly values our industry relationships and is committed to providing any relevant information and resources that may be helpful to our partners as they engage with clients on solutions focused on Centers of Excellence and bundled payments.
To assist with providing additional education and information on the concept of Centers of Excellence, the following topics have been made available on this site.
- Why focus on Surgery
-
The Case for COEs – Why Focus on Surgery?
Key Point: Surgical Spend is Meaningful for a Plan Sponsor, consistently falling within the top 2 or 3 drivers of medical spend for an employer. A solution that focuses on plannable surgical events can provide a way to address costs associated to about a quarter of a company’s total medical spend but that only impacts a fraction of a company’s total member population, thereby limiting disruption. This allows plan sponsors to be very targeted with a solution that can create tangible reductions in cost for a very meaningful portion of a Company’s medical spend.
Attributes of Surgical Spend
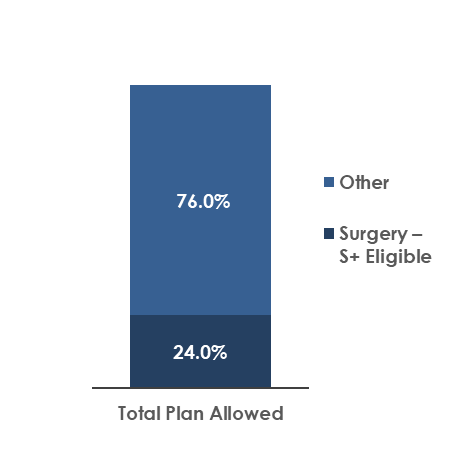
- When reviewing historical claims information and comparing the plannable surgical procedures experienced by members to the 1,500+ CPT codes covered under the SurgeryPlus benefit, we can determine that on average, 24% of a company’s medical spend (excluding pharmacy) is on surgical procedures that can be administered through SurgeryPlus.
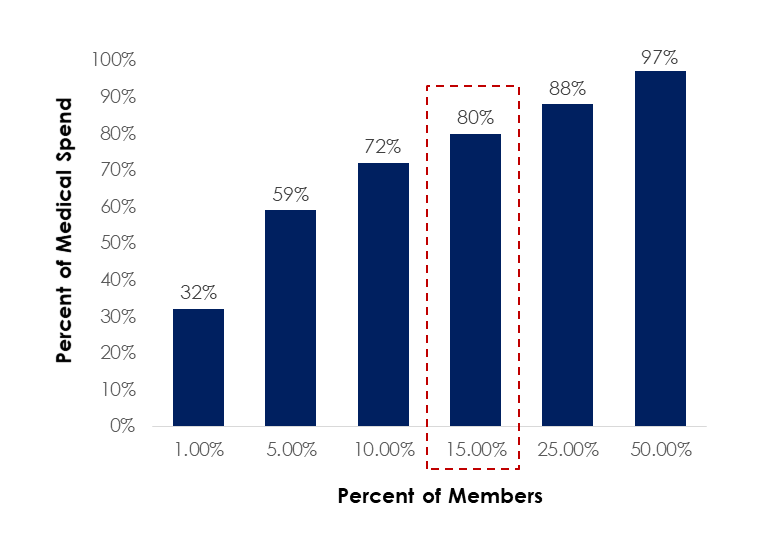
- When looking at spend per member, we see that 15% of members drive about 80% of a company’s medical spend.
Focusing on surgical events allows plan sponsors to concentrate their time and energy on a solution that can dramatically impact the dollars spent on medical expenses, while only affecting a small percent of member population.
Surgical spend as a percent of total medical spend
Allocation of total medical cost based on cumulative percent of members
- Why focus on Quality
-
The Case for COEs – Why Focus on Quality?
Key Point: Quality Matters. A solution that steers members to higher quality surgical providers helps ensure a better member experience through more appropriate treatment paths and more favorable health outcomes. Using the SurgeryPlus Surgeons of Excellence model ensures that members are getting care from high quality providers that are specialists for their specific care needs, resulting in dramatically lower complications, improved outcomes and a better overall healthcare experience.
Although largely ignored, certain areas of healthcare within the US suffer from severe quality issues, making finding quality care all that much more important.
- The U.S. spends more on health case as a share of the economy – nearly twice as much as the average OECD country – yet has the lowest life expectancy and highest suicide rates among the 11 nations1
- Compared to peer nations, the U.S. has among the highest number of hospitalizations from preventable causes and the highest rate of avoidable deaths1
- Medical errors are the 3rd leading cause of death in America, behind heart disease and cancer.
- Privately insured surgical patients who had a complication provided hospitals with a 330% higher profit margin than those without a complications2
1 The Commonwealth Fund, Jan 30, 2020
2 Ariadne Labs Research, Harvard School of Public Health Press Release, 2013
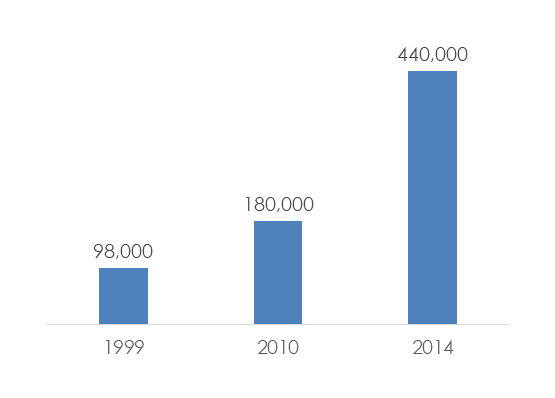
In 2014, it was estimated that 440,000 people went to a hospital for care and suffered some type of preventable harm that contributed to their death.
Annual Number of Deaths from Preventable Harm Experienced in a Hospital
- Why focus on Cost
-
The Case for COEs – Why Focus on Cost?
Key Point:
Cost Containment is Top of Mind. The increasing burden of rising healthcare costs on employers forces them to explore various alternatives in order to manage these costs. A supplemental solution like SurgeryPlus, that drives savings is a much more appealing solution to combatting these rising costs than increasing member cost share, work force reductions or removing benefit options. The tangible contract savings realized by plan sponsors who have implemented SurgeryPlus have produced meaningful reductions in a company’s annual medical spend and provided a better alternative to managing these expenses.
Medical Costs, which generally represent the 2nd largest expense on a company’s income statement, have exponentially risen in recent years and are expected to continue rising for the foreseeable future.
- Utilization and spending are expected to increase in 2022 as some care deferred during the pandemic returns, costs to test for, treat and vaccinate against COVID-19 continue, rates of mental health and substance abuse issues remain high and population health worsens1
- Large employers project that their health benefits costs will rise 5.3% in 2021. The projected rise in health benefits costs, which takes employers’ health plan cost-management changes into account, is slightly higher than the 5% increases in large employers projected in each of the last 5 years2
- Employers remain the main source of health insurance in the United States, covering about 153 million people. But premiums and deductibles are pushing employer-based coverage increasingly out of reach for employees3
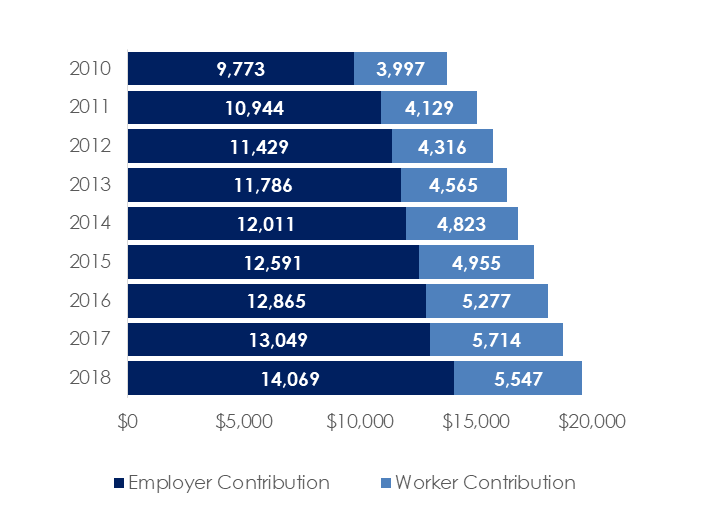
Composition of average employer premium payments (per employee) 4
1 PwC Health Research Institute
2 Business Group on Health
3 Kaiser Family Foundation
4 KFE Employer Health Benefits Survey 2018, Kaiser/HRET Survey of Employer Sponsored Health Benefits - SurgeryPlus Differentiators
-
SurgeryPlus Differentiators
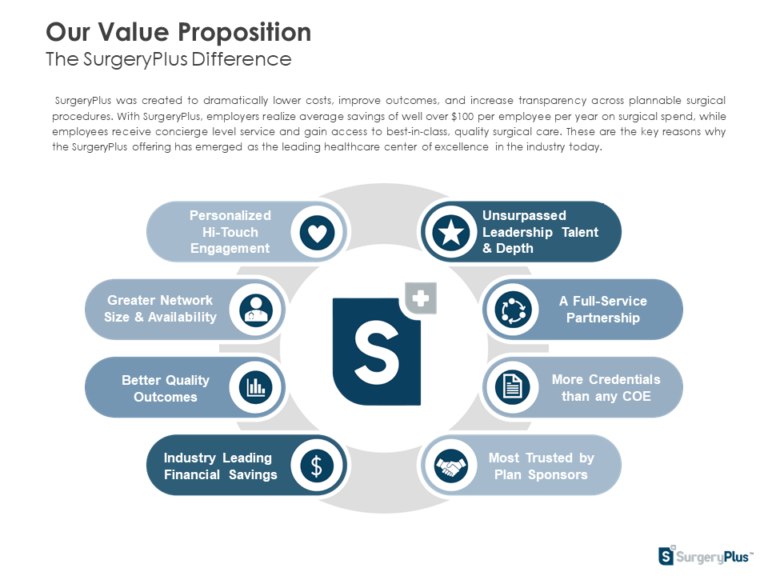
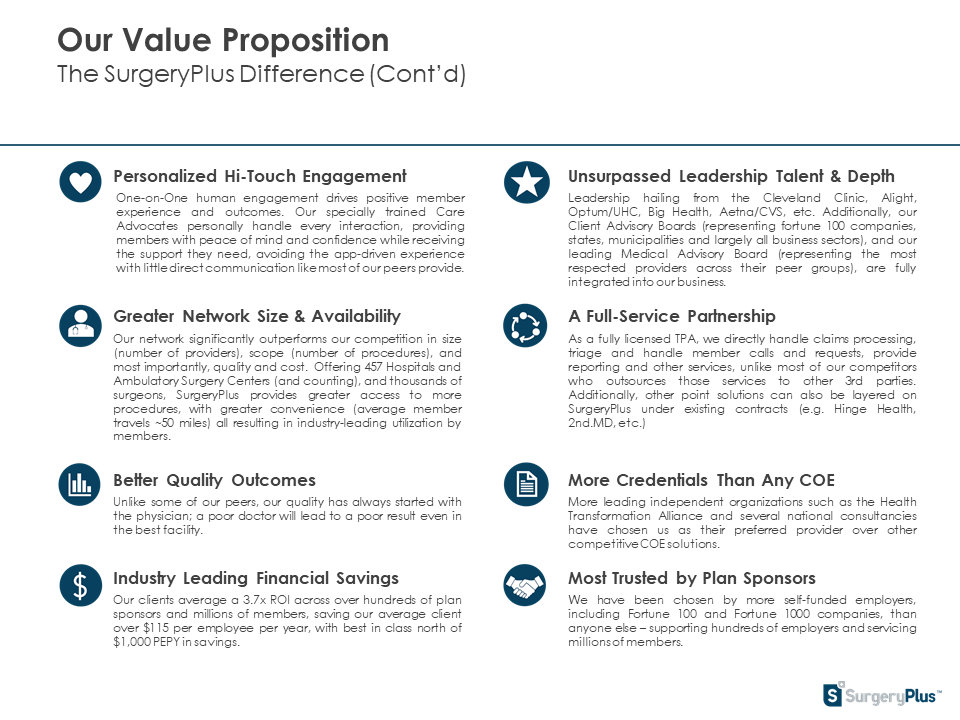
With SurgeryPlus, employers realize average savings of well over $100 per employee per year on surgical spend, while employees receive concierge level service and gain access to best-in-class, quality surgical care. These are the key reasons why the SurgeryPlus offering has emerged as the leading healthcare center of excellence in the industry today.
- SurgeryPlus Program Overview
-
SurgeryPlus Program Overview
SurgeryPlus was created to dramatically lower costs, improve outcomes and transparency across nearly 1,500 plannable surgical procedures. The surgical procedures we cover typically account for 24% of an employer’s overall medical spend (excluding pharmacy) each year. With SurgeryPlus, employers realize average annual savings of over $100 per employee on the highest cost, lowest frequency drivers of surgical spend, while accessing best-in-class quality care and outcomes for plan members.
Aligning Compassion, Quality Care and Cost
Surgery Plus Case Study
Learn how a major grocery chain got strong results with SurgeryPlus and a mandatory plan design
- Network Access
-
Provider Network Footprint and Geo Access
As the nation’s leading Centers of Excellence program, SurgeryPlus has the largest network of high-quality providers with over 400 Hospitals and Surgery Centers in the U.S., offering best-in-class access to top-quality care. The geographic footprint for SurgeryPlus facilities is constantly expanding to meet the needs of our growing client base. A snapshot of the current geographic footprint as of mid-2021 is provided below.
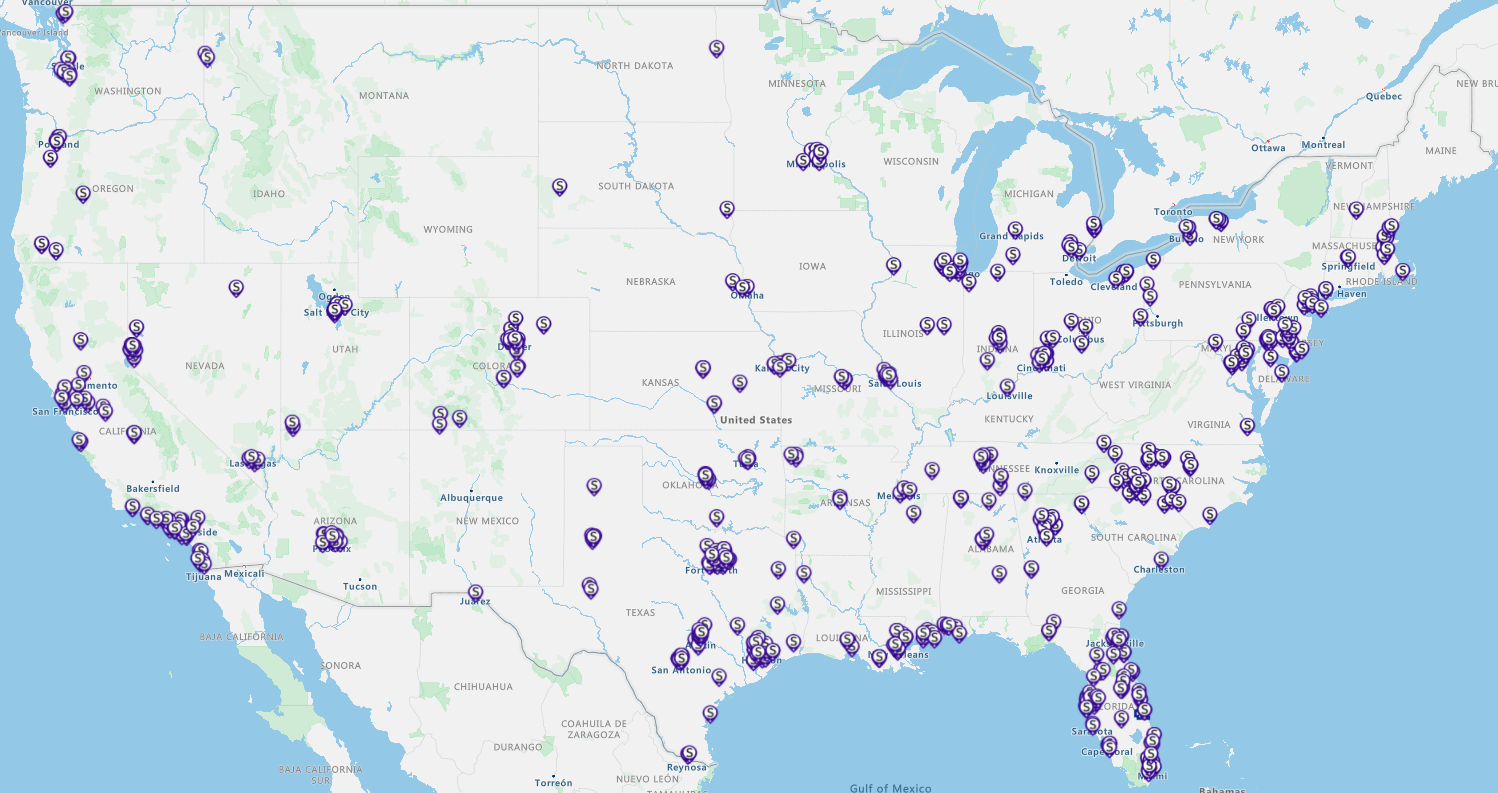
The average distance a member traveled for care in 2020 was ~65 miles and this average distance traveled in 2021 is approaching 50 miles.
While more expansive than any COE network in the US, to solve for quality and cost, the provider network has to remain narrow in focus. By design we do not have providers in every US city and there are pockets of the US where provider access is still thin. At present, our network is 2-3x larger than our competitors but still 2-3x smaller than where we aspire to be.
Strategic Approach to building our network
We target network development in the largest 50 MSAs in the country. If we can be in those cities, we are no more than an hour drive from 80% of the US population.
Tactical Approach to building our network
We develop provider capabilities in cities that matter to our clients and to their members. For example, Tulsa OK, was a meaningful city for one of our clients, based on the number of members in the area, so despite Tulsa not being a top 50 MSA, we developed a full suite of provider capabilities to offer local coverage across all surgical categories in Tulsa.
Geo Access Analysis
For any account, SurgeryPlus is able to run a Geo Access report to identify member proximity to SurgeryPlus providers. This analysis provides details around surgical fulfillment capabilities within each of the client’s key geographical areas.
Data Required: The only data needed to produce a geo access report is a zip code file containing a unique zip code for each subscriber. Additional information contained in a standard census file such as gender, age, etc., can be helpful, but is not required to assess member proximity to the SurgeryPlus network.
Time to Complete: General time to complete a Geo Access Report is 5 business days, but we try to maintain flexibility if the analysis is needed sooner.
Request a Geo Access Report
Use the form included below in the Additional Resources Section to request examples of geo access analysis capabilities or to have someone from the Business Development team contact you about starting the process to obtain a Geo Access Report for a specific account.
- Covered Procedures
-
Covered Procedures
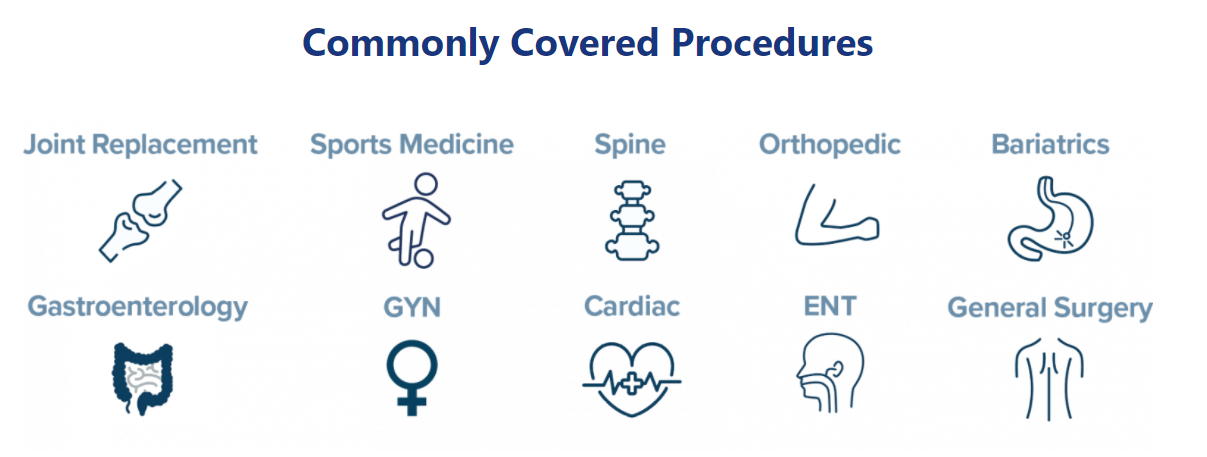
Through our national network of providers, the SurgeryPlus benefit is able to offer surgical fulfillment for over 1,500 CPT codes, each code representing a unique, plannable surgical procedure. The depth / breadth of procedures administered by SurgeryPlus is a point of differentiation. While the focus of members using SurgeryPlus tends to be on the more complex surgical needs such as MSK related procedures, the ability to use SurgeryPlus for a broader set of procedures allows members to gain access to high quality care at a more affordable price for any of their surgical needs.
To simplify the messaging around what procedures are available through a member’s SurgeryPlus benefit, we tend to focus on covered procedures in terms of categories as opposed to individual surgeries. Covered procedure categories administered under the SurgeryPlus benefit are included below.
- Member Experience
-
Member Experience
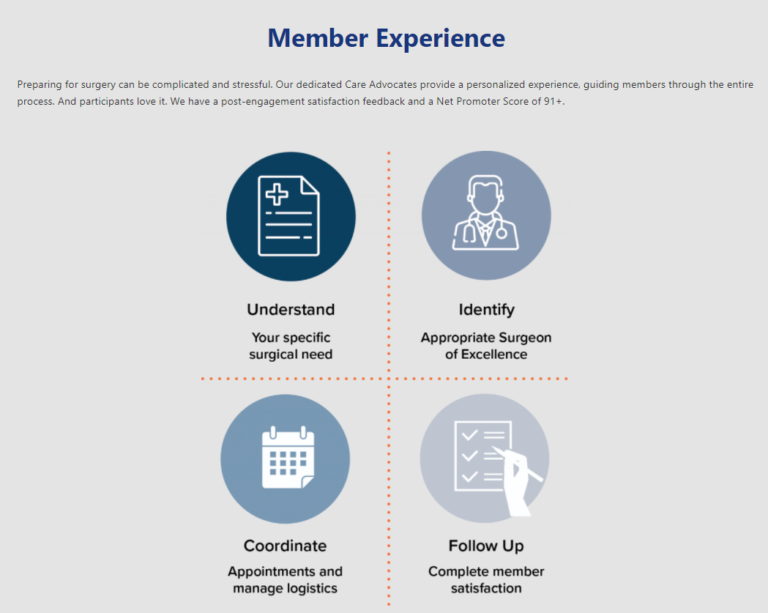
"SurgeryPlus allows you to have the peace of mind that you will not be facing large medical bills. I was able to have the surgery and follow-up physical therapy without out-of-pocket funds. Everything was taken care of. I simply had to work on getting better and not worry about the expense.”SurgeryPlus MemberOur Care Advocates provide personalized 1-on-1 support and stewardship throughout the surgical journey, leading to superior member satisfaction and optimized outcomes for hundreds of plan sponsors and millions of members. These Care Advocates create a truly differentiated experience for our members and are often cited by people who use our program as the best part of the benefit.
As depicted below, once a member engages with the SurgeryPlus, the Care Advocate team handles all of the logistics required to create a seamless member experience, including educating the member, answering questions, identifying high quality providers, coordinating information among all participating parties and assisting with all follow-up activities.
Key Attributes of the Member Experience
- High touch human interaction
- Full-service concierge approach
- All internal resources (no outsourcing)
- Multiple ways to connect to the team
- Dedicated resource throughout the entire journey
- Post care coordination
- No member bills
- Quality Outcomes
-
Quality Outcomes
Through the SurgeryPlus Centers of Excellence network, credentialing is performed at both the facility and the surgeon level in order to ensure the highest quality outcomes for our members. The credentialling approach used by SurgeryPlus has produced an industry leading complication rate below 1% for each of the last five years, with a complication rate less than 0.5% in 2020.
Additionally, due to the low frequency of occurrences, complication rates for the SurgeryPlus book of business are a combination of both complications and readmissions, making the less than 1% rates an even higher indication of qualityComparing the SurgeryPlus complication rates to industry averages, which depending on surgical category and source can range anywhere between 2%-3% on the low side to upwards of 15% on the high side, demonstrates the ability of the SurgeryPlus network to generate outcomes that are orders of magnitude better than industry averages, ensuring members the quality care they deserve.
Examples of importance of quality providers to member outcomes are included below.
Facility Credentialing
Historically, Center of Excellence models have focused on steering members to high quality facilities. The SurgeryPlus network uses a similar credentialing approach to ensure members are only receiving care from highly accredited facilities. As part of our focus on facility quality, site of care appropriateness is critical to our outcome performance and highlights the value generated by network depth that includes all venue types:
- Inpatient
- Hospital outpatient
- Surgery center (e.g., ASC)
When credentialing our facilities, we use verifiable data sources. A few key examples of information used to credential facilities is included below:
- CMS regulated quality and outcome data including but not limited to:
- Hospital Acquired Condition (HAC) scores
- Readmittance rates – Overall and procedure category specific
- Complication rates – Overall and procedure category specific
- Surgical site infection rates
- Accreditations
- AHD
- Provider-provided metrics and data
Surgeon Credentialing
The credentialling process for SurgeryPlus Centers of Excellence goes beyond the traditional approach of only assessing facility quality and also focuses on credentialing at the surgeon level. This allows SurgeryPlus to steer members to the exact operative surgeon at the hand selected facility, which dramatically improves member outcomes. The initial credentialing process at SurgeryPlus eliminates approximately 60% – 75% of in-network surgeons for inclusion in our network.
For any surgeon that passes the initial credentialling process, SurgeryPlus performs a series of interviews to understand practices and protocols used by each surgeon to control for modifiable risk factors and optimize surgical outcomes for members.
Re-credentialling
We re-credential our facilities and surgeons annually. If either were to fail re-credentialing, they are terminated from our network. If a complication occurs, both the facility and surgeon are placed on a temporary suspension until a thorough review has been conducted. If it is determined that the complication was the fault of our provider’s negligence or deviation from the accepted standard of care for that surgical procedure, that provider is also terminated from our network.
For a detailed overview of the credentialing process for facility and surgeons, please use the Additional Resources form to request the Provider Quality Overview presentation.
- Bundled Payment Savings
-
SurgeryPlus Bundled Payments and Procedure Costs
SurgeryPlus has created a narrow network of high quality providers. These providers are contracted with SurgeryPlus at substantially lower rates than plan sponsors are paying for the same surgical procedures through traditional BUCA networks, allowing clients to generate meaningful savings on completed surgeries and thereby lowering their medical spend.
Bundled Rates
The SurgeryPlus bundled rates include everything from the time a member enters the facility (“admit”) to the time that the member goes home (“discharge”) plus any follow-up consultations that occur within the global Medicare window (typically 90 days). This includes all charges related to the facility, surgeon, and anesthesiologist. Examples of items not included in the bundle are those items that occur prior to or after the procedure including things like pre-op imaging, physical therapy, or durable medical equipment.
Realized Savings
As part of the contracting process, SurgeryPlus targets contract rates that are between 100% and 135% of Medicare, which is typically 50% or more below commercial reimbursement rates. In 2020, SugeryPlus was able to create an average contract-to-contract savings rate of 52.3% for our clients.
Savings Analysis
Regression Based Savings
Provides an approximate estimate of savings that could be realized through the SurgeryPlus program, based on client specific information around medical spend and employee counts.
Data Requirements:
- 12-24 months total allowed medical spend (no Rx)
- Average number of enrolled employees (subscribers) for time periods associated to medical spend information above
- Average number of total members for time periods associated to medical spend information above
Time to Complete: General time to complete a Regression-Based Savings Analysis is 5 business days, but we try to maintain flexibility if the analysis is needed sooner.
Full Claims Repricing
The full claims repricing analysis uses a client’s claims history to compare the actual price paid by the plan sponsor for each surgical procedure to the price that would’ve been paid had that episode been administered through the SurgeryPlus network.
Data Requirements: 12-24 months of claims history, to include at minimum:
- Date of Service
- Unique Member ID
- CPT code
- Allowed Amount
- Provider NPI number or Provider Zip
Time to Complete: General time to complete a full claims repricing is 10 business days, but we try to maintain flexibility if the analysis is needed sooner.
Request Savings Estimates
Use the form included below in the Additional Resources Section to request examples of savings analysis capabilities or to have someone from the Business Development team contact you about starting the process to obtain Savings Estimates for a specific account.
The Case for COEs – Why Focus on Surgery?
Key Point: Surgical Spend is Meaningful for a Plan Sponsor, consistently falling within the top 2 or 3 drivers of medical spend for an employer. A solution that focuses on plannable surgical events can provide a way to address costs associated to about a quarter of a company’s total medical spend but that only impacts a fraction of a company’s total member population, thereby limiting disruption. This allows plan sponsors to be very targeted with a solution that can create tangible reductions in cost for a very meaningful portion of a Company’s medical spend.
Attributes of Surgical Spend
- When reviewing historical claims information and comparing the plannable surgical procedures experienced by members to the 1,500+ CPT codes covered under the SurgeryPlus benefit, we can determine that on average, 24% of a company’s medical spend (excluding pharmacy) is on surgical procedures that can be administered through SurgeryPlus.
- When looking at spend per member, we see that 15% of members drive about 80% of a company’s medical spend.
Focusing on surgical events allows plan sponsors to concentrate their time and energy on a solution that can dramatically impact the dollars spent on medical expenses, while only affecting a small percent of member population.
Surgical spend as a percent of total medical spend
Allocation of total medical cost based on cumulative percent of members
The Case for COEs – Why Focus on Quality?
Key Point: Quality Matters. A solution that steers members to higher quality surgical providers helps ensure a better member experience through more appropriate treatment paths and more favorable health outcomes. Using the SurgeryPlus Surgeons of Excellence model ensures that members are getting care from high quality providers that are specialists for their specific care needs, resulting in dramatically lower complications, improved outcomes and a better overall healthcare experience.
Although largely ignored, certain areas of healthcare within the US suffer from severe quality issues, making finding quality care all that much more important.
- The U.S. spends more on health case as a share of the economy – nearly twice as much as the average OECD country – yet has the lowest life expectancy and highest suicide rates among the 11 nations1
- Compared to peer nations, the U.S. has among the highest number of hospitalizations from preventable causes and the highest rate of avoidable deaths1
- Medical errors are the 3rd leading cause of death in America, behind heart disease and cancer.
- Privately insured surgical patients who had a complication provided hospitals with a 330% higher profit margin than those without a complications2
1 The Commonwealth Fund, Jan 30, 2020
2 Ariadne Labs Research, Harvard School of Public Health Press Release, 2013
In 2014, it was estimated that 440,000 people went to a hospital for care and suffered some type of preventable harm that contributed to their death.
Annual Number of Deaths from Preventable Harm Experienced in a Hospital
The Case for COEs – Why Focus on Cost?
Key Point:
Cost Containment is Top of Mind. The increasing burden of rising healthcare costs on employers forces them to explore various alternatives in order to manage these costs. A supplemental solution like SurgeryPlus, that drives savings is a much more appealing solution to combatting these rising costs than increasing member cost share, work force reductions or removing benefit options. The tangible contract savings realized by plan sponsors who have implemented SurgeryPlus have produced meaningful reductions in a company’s annual medical spend and provided a better alternative to managing these expenses.
Medical Costs, which generally represent the 2nd largest expense on a company’s income statement, have exponentially risen in recent years and are expected to continue rising for the foreseeable future.
- Utilization and spending are expected to increase in 2022 as some care deferred during the pandemic returns, costs to test for, treat and vaccinate against COVID-19 continue, rates of mental health and substance abuse issues remain high and population health worsens1
- Large employers project that their health benefits costs will rise 5.3% in 2021. The projected rise in health benefits costs, which takes employers’ health plan cost-management changes into account, is slightly higher than the 5% increases in large employers projected in each of the last 5 years2
- Employers remain the main source of health insurance in the United States, covering about 153 million people. But premiums and deductibles are pushing employer-based coverage increasingly out of reach for employees3
Composition of average employer premium payments (per employee) 4
1 PwC Health Research Institute
2 Business Group on Health
3 Kaiser Family Foundation
4 KFE Employer Health Benefits Survey 2018, Kaiser/HRET Survey of Employer Sponsored Health Benefits
SurgeryPlus Differentiators
With SurgeryPlus, employers realize average savings of well over $100 per employee per year on surgical spend, while employees receive concierge level service and gain access to best-in-class, quality surgical care. These are the key reasons why the SurgeryPlus offering has emerged as the leading healthcare center of excellence in the industry today.
SurgeryPlus Program Overview
SurgeryPlus was created to dramatically lower costs, improve outcomes and transparency across nearly 1,500 plannable surgical procedures. The surgical procedures we cover typically account for 24% of an employer’s overall medical spend (excluding pharmacy) each year. With SurgeryPlus, employers realize average annual savings of over $100 per employee on the highest cost, lowest frequency drivers of surgical spend, while accessing best-in-class quality care and outcomes for plan members.
Aligning Compassion, Quality Care and Cost
Surgery Plus Case Study
Learn how a major grocery chain got strong results with SurgeryPlus and a mandatory plan design
Provider Network Footprint and Geo Access
As the nation’s leading Centers of Excellence program, SurgeryPlus has the largest network of high-quality providers with over 400 Hospitals and Surgery Centers in the U.S., offering best-in-class access to top-quality care. The geographic footprint for SurgeryPlus facilities is constantly expanding to meet the needs of our growing client base. A snapshot of the current geographic footprint as of mid-2021 is provided below.
The average distance a member traveled for care in 2020 was ~65 miles and this average distance traveled in 2021 is approaching 50 miles.
While more expansive than any COE network in the US, to solve for quality and cost, the provider network has to remain narrow in focus. By design we do not have providers in every US city and there are pockets of the US where provider access is still thin. At present, our network is 2-3x larger than our competitors but still 2-3x smaller than where we aspire to be.
Strategic Approach to building our network
We target network development in the largest 50 MSAs in the country. If we can be in those cities, we are no more than an hour drive from 80% of the US population.
Tactical Approach to building our network
We develop provider capabilities in cities that matter to our clients and to their members. For example, Tulsa OK, was a meaningful city for one of our clients, based on the number of members in the area, so despite Tulsa not being a top 50 MSA, we developed a full suite of provider capabilities to offer local coverage across all surgical categories in Tulsa.
Geo Access Analysis
For any account, SurgeryPlus is able to run a Geo Access report to identify member proximity to SurgeryPlus providers. This analysis provides details around surgical fulfillment capabilities within each of the client’s key geographical areas.
Data Required: The only data needed to produce a geo access report is a zip code file containing a unique zip code for each subscriber. Additional information contained in a standard census file such as gender, age, etc., can be helpful, but is not required to assess member proximity to the SurgeryPlus network.
Time to Complete: General time to complete a Geo Access Report is 5 business days, but we try to maintain flexibility if the analysis is needed sooner.
Request a Geo Access Report
Use the form included below in the Additional Resources Section to request examples of geo access analysis capabilities or to have someone from the Business Development team contact you about starting the process to obtain a Geo Access Report for a specific account.
Covered Procedures
Through our national network of providers, the SurgeryPlus benefit is able to offer surgical fulfillment for over 1,500 CPT codes, each code representing a unique, plannable surgical procedure. The depth / breadth of procedures administered by SurgeryPlus is a point of differentiation. While the focus of members using SurgeryPlus tends to be on the more complex surgical needs such as MSK related procedures, the ability to use SurgeryPlus for a broader set of procedures allows members to gain access to high quality care at a more affordable price for any of their surgical needs.
To simplify the messaging around what procedures are available through a member’s SurgeryPlus benefit, we tend to focus on covered procedures in terms of categories as opposed to individual surgeries. Covered procedure categories administered under the SurgeryPlus benefit are included below.
Member Experience
Our Care Advocates provide personalized 1-on-1 support and stewardship throughout the surgical journey, leading to superior member satisfaction and optimized outcomes for hundreds of plan sponsors and millions of members. These Care Advocates create a truly differentiated experience for our members and are often cited by people who use our program as the best part of the benefit.
As depicted below, once a member engages with the SurgeryPlus, the Care Advocate team handles all of the logistics required to create a seamless member experience, including educating the member, answering questions, identifying high quality providers, coordinating information among all participating parties and assisting with all follow-up activities.
Key Attributes of the Member Experience
- High touch human interaction
- Full-service concierge approach
- All internal resources (no outsourcing)
- Multiple ways to connect to the team
- Dedicated resource throughout the entire journey
- Post care coordination
- No member bills
Quality Outcomes
Through the SurgeryPlus Centers of Excellence network, credentialing is performed at both the facility and the surgeon level in order to ensure the highest quality outcomes for our members. The credentialling approach used by SurgeryPlus has produced an industry leading complication rate below 1% for each of the last five years, with a complication rate less than 0.5% in 2020.
Additionally, due to the low frequency of occurrences, complication rates for the SurgeryPlus book of business are a combination of both complications and readmissions, making the less than 1% rates an even higher indication of quality
Comparing the SurgeryPlus complication rates to industry averages, which depending on surgical category and source can range anywhere between 2%-3% on the low side to upwards of 15% on the high side, demonstrates the ability of the SurgeryPlus network to generate outcomes that are orders of magnitude better than industry averages, ensuring members the quality care they deserve.
Examples of importance of quality providers to member outcomes are included below.
Facility Credentialing
Historically, Center of Excellence models have focused on steering members to high quality facilities. The SurgeryPlus network uses a similar credentialing approach to ensure members are only receiving care from highly accredited facilities. As part of our focus on facility quality, site of care appropriateness is critical to our outcome performance and highlights the value generated by network depth that includes all venue types:
- Inpatient
- Hospital outpatient
- Surgery center (e.g., ASC)
When credentialing our facilities, we use verifiable data sources. A few key examples of information used to credential facilities is included below:
- CMS regulated quality and outcome data including but not limited to:
- Hospital Acquired Condition (HAC) scores
- Readmittance rates – Overall and procedure category specific
- Complication rates – Overall and procedure category specific
- Surgical site infection rates
- Accreditations
- AHD
- Provider-provided metrics and data
Surgeon Credentialing
The credentialling process for SurgeryPlus Centers of Excellence goes beyond the traditional approach of only assessing facility quality and also focuses on credentialing at the surgeon level. This allows SurgeryPlus to steer members to the exact operative surgeon at the hand selected facility, which dramatically improves member outcomes. The initial credentialing process at SurgeryPlus eliminates approximately 60% – 75% of in-network surgeons for inclusion in our network.
For any surgeon that passes the initial credentialling process, SurgeryPlus performs a series of interviews to understand practices and protocols used by each surgeon to control for modifiable risk factors and optimize surgical outcomes for members.
Re-credentialling
We re-credential our facilities and surgeons annually. If either were to fail re-credentialing, they are terminated from our network. If a complication occurs, both the facility and surgeon are placed on a temporary suspension until a thorough review has been conducted. If it is determined that the complication was the fault of our provider’s negligence or deviation from the accepted standard of care for that surgical procedure, that provider is also terminated from our network.
For a detailed overview of the credentialing process for facility and surgeons, please use the Additional Resources form to request the Provider Quality Overview presentation.
SurgeryPlus Bundled Payments and Procedure Costs
SurgeryPlus has created a narrow network of high quality providers. These providers are contracted with SurgeryPlus at substantially lower rates than plan sponsors are paying for the same surgical procedures through traditional BUCA networks, allowing clients to generate meaningful savings on completed surgeries and thereby lowering their medical spend.
Bundled Rates
The SurgeryPlus bundled rates include everything from the time a member enters the facility (“admit”) to the time that the member goes home (“discharge”) plus any follow-up consultations that occur within the global Medicare window (typically 90 days). This includes all charges related to the facility, surgeon, and anesthesiologist. Examples of items not included in the bundle are those items that occur prior to or after the procedure including things like pre-op imaging, physical therapy, or durable medical equipment.
Realized Savings
As part of the contracting process, SurgeryPlus targets contract rates that are between 100% and 135% of Medicare, which is typically 50% or more below commercial reimbursement rates. In 2020, SugeryPlus was able to create an average contract-to-contract savings rate of 52.3% for our clients.
Savings Analysis
Regression Based Savings
Provides an approximate estimate of savings that could be realized through the SurgeryPlus program, based on client specific information around medical spend and employee counts.
Data Requirements:
- 12-24 months total allowed medical spend (no Rx)
- Average number of enrolled employees (subscribers) for time periods associated to medical spend information above
- Average number of total members for time periods associated to medical spend information above
Time to Complete: General time to complete a Regression-Based Savings Analysis is 5 business days, but we try to maintain flexibility if the analysis is needed sooner.
Full Claims Repricing
The full claims repricing analysis uses a client’s claims history to compare the actual price paid by the plan sponsor for each surgical procedure to the price that would’ve been paid had that episode been administered through the SurgeryPlus network.
Data Requirements: 12-24 months of claims history, to include at minimum:
- Date of Service
- Unique Member ID
- CPT code
- Allowed Amount
- Provider NPI number or Provider Zip
Time to Complete: General time to complete a full claims repricing is 10 business days, but we try to maintain flexibility if the analysis is needed sooner.
Request Savings Estimates
Use the form included below in the Additional Resources Section to request examples of savings analysis capabilities or to have someone from the Business Development team contact you about starting the process to obtain Savings Estimates for a specific account.
Additional Resources Available
Additional information can be obtained upon request. Please access the Form below to request additional available information as required.